
Introduction: Why SCHD Dividend Growth Can Feel Slow at First
The Problem With Watching Only Today’s Dividend
Building dividend income can feel frustrating at the beginning. A small investment may produce only a small quarterly dividend. Therefore, the first few years can seem slow. The investor may see little change in the income amount. This can make long-term dividend investing feel less exciting.
The Power of Reinvesting Small Payments
However, dividend reinvestment can change the growth path. Instead of taking each payment as cash, the investor can use it to buy more shares. Those additional shares can then produce future dividends. Over time, this creates a dividend snowball effect. A SCHD Dividend Snowball Calculator helps investors see this process through projections.
What Is SCHD and Why Do Investors Track Its Dividends?
SCHD Is a Dividend-Focused ETF
SCHD is the Schwab U.S. Dividend Equity ETF. It is designed around U.S. companies with dividend-focused characteristics. The fund holds a portfolio of large companies across different industries. Schwab publishes current holdings, distributions, and performance information for the ETF.
SCHD Provides Quarterly Dividend Payments
SCHD has historically made dividend distributions during the year. For example, Schwab lists 2026 distribution dates in March and June. Previous records also show distributions in September and December. Therefore, investors often describe SCHD as a quarterly dividend ETF.
SCHD Dividend Income Depends on Several Factors
Dividend income does not depend only on the number of shares. The dividend per share can change over time. The share price can also move up or down. In addition, dividend growth can affect future income. Therefore, a useful SCHD investment calculator should consider several inputs.
SCHD Is More Than a Simple Yield Number
A displayed dividend yield is only one part of the picture. Schwab explains that ETF yield can use different calculation methods. For example, investors may see a 30-day SEC yield or a trailing distribution yield. These measures can produce different results.
What Is a SCHD Dividend Snowball?
The Dividend Snowball Explained Simply
A dividend snowball is a process where dividend income helps create more dividend income. The investor receives a dividend payment first. Then, the payment is reinvested into additional shares. Those shares can produce more dividends later.
How the Snowball Starts
The snowball usually starts with the original investment. That investment buys a certain number of SCHD shares. The shares generate quarterly dividends. If those dividends are reinvested, the investor can purchase additional shares. The process then repeats.
Why Additional Shares Matter
Additional shares can become an important part of long-term compounding. Each new share increases the future share count. A larger share count can produce larger dividend payments. Consequently, the next reinvestment may purchase even more shares.
The Snowball Does Not Grow in a Straight Line
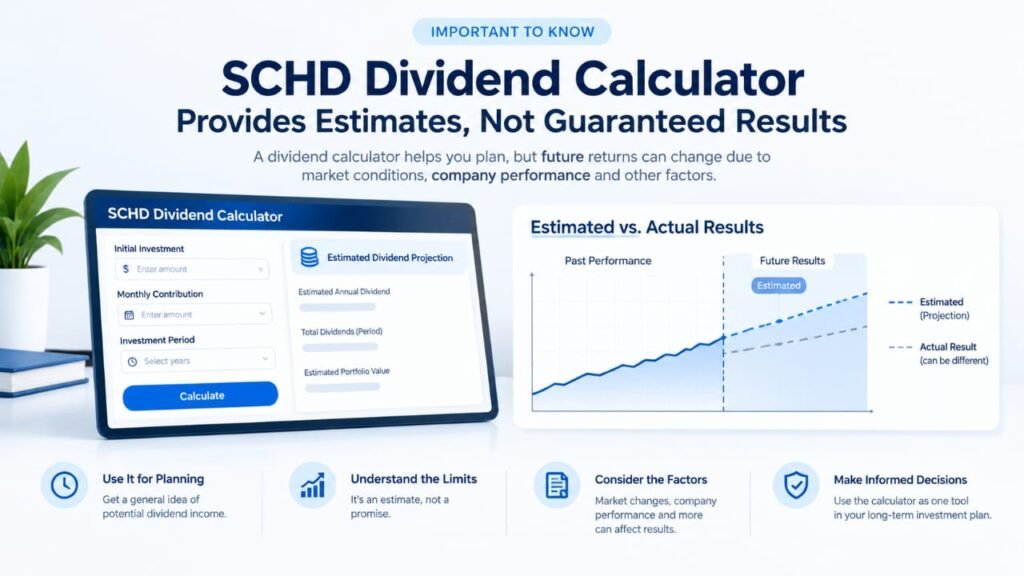
Dividend growth is not normally a perfectly straight process. Share prices change throughout the market cycle. Dividend payments can also change. Therefore, actual results can differ from a simple projection. A calculator should be viewed as an estimate, not a promise.
How Does SCHD DRIP Work?
DRIP Means Dividend Reinvestment Plan
DRIP stands for Dividend Reinvestment Plan. Under a DRIP approach, eligible dividend payments are used to purchase more shares. Instead of receiving the dividend entirely as cash, the investor adds it back into the investment.
Reinvestment Can Increase the Share Count
Suppose an investor owns 100 SCHD shares. The fund pays a dividend distribution. Instead of keeping that money as cash, the investor reinvests it. The account can then receive additional shares. The exact number depends on the dividend amount and purchase price.
Fractional Shares Can Matter
Some brokerage accounts allow fractional shares. This can make reinvestment more precise. A small dividend does not always need to wait until enough cash exists for a full share. However, fractional-share rules depend on the brokerage.
DRIP Can Create a Compounding Effect
The main idea behind DRIP is compounding. Dividends buy additional shares. Those shares can produce future dividends. Then, those future dividends can buy more shares. This repeating cycle creates the dividend snowball effect.
How a SCHD Dividend Snowball Calculator Works
Starting Investment Is the First Input
A calculator usually begins with the initial investment. This could be $1,000, $10,000, or another amount. The starting amount determines the initial share count. A larger starting amount generally creates a larger starting income stream.
Share Price Helps Estimate the Starting Shares
The share price can be used to estimate how many shares the investment can buy. For example, a simple calculation is:
Initial Shares = Initial Investment ÷ Share Price
This calculation provides an estimated starting share count. Actual purchases can differ because market prices change.
Dividend Per Share Estimates Initial Income
The dividend per share helps estimate dividend income. A simple yearly estimate can be calculated as:
Annual Dividend Income = Shares × Annual Dividend Per Share
This is useful for understanding the starting income level. However, future dividend payments may not remain unchanged.
Dividend Growth Changes Future Income
A dividend growth assumption can be added to a projection. For example, an investor could model a specific annual growth rate. The calculator then estimates how the dividend per share may change. This creates a possible future dividend income path.
Reinvestment Changes the Share Count
When dividends are reinvested, the share count can increase. The calculation can then use the new share count for future periods. This is one of the main differences between a basic dividend calculator and a DRIP calculator.
Time Gives Compounding More Room
Time is another important input. A five-year projection behaves differently from a 20-year projection. The longer period gives reinvested dividends more opportunities to purchase additional shares. Therefore, time is central to dividend snowball calculations.
SCHD Dividend Calculator vs. SCHD DRIP Calculator
A Basic SCHD Dividend Calculator
A basic SCHD dividend calculator may estimate dividend income from a share count. It can also use dividend yield or annual dividend data. This makes it useful for a quick income estimate.
A SCHD DRIP Calculator
A SCHD DRIP calculator goes one step further. It models dividend reinvestment into additional shares. Therefore, the projected share count can change over time.
A SCHD Dividend Reinvestment Calculator
A SCHD dividend reinvestment calculator focuses on the effect of reinvesting distributions. It can help show how dividend income may compound. This is especially useful for long-term investors.
A SCHD Dividend Calculator With DRIP
A calculator with DRIP can combine several assumptions. These may include initial investment, share price, dividend yield, dividend growth, and time. It can then estimate future shares and dividend income.
Why the Difference Matters
The two calculators answer different questions. A basic calculator asks how much income the current investment may produce. A DRIP calculator asks how reinvestment could change future income. Therefore, investors should choose the calculator that matches their goal.
How Dividend Reinvestment Creates a Snowball
Step One: The Investor Buys SCHD
The process begins when an investor buys SCHD shares. The number of shares depends on the investment amount and purchase price. Those shares become the foundation of the dividend portfolio.
Step Two: SCHD Pays a Dividend
The ETF distributes income to shareholders. Schwab publishes official distribution information for SCHD. The payment amount can change between distribution periods.
Step Three: The Dividend Buys More Shares
With DRIP enabled, the dividend can be reinvested. The investor receives additional shares based on the available dividend cash. The result is a higher share count.
Step Four: More Shares Produce More Income
The new shares can participate in future distributions. Therefore, the next dividend can be larger if other factors remain supportive. This is the basic compounding mechanism behind the dividend snowball.
Step Five: The Process Repeats
The cycle continues through future dividend payments. Each round can add more shares. Over a long period, the effect can become more noticeable. However, actual results will depend on future market and dividend conditions.
Important Inputs for a SCHD Dividend Snowball Projection
Initial Investment
The initial investment represents the amount invested at the beginning. It is one of the most important calculator inputs. A higher initial amount creates a larger starting position.
Additional Investment
Some investors add money regularly. This may happen monthly, quarterly, or annually. Regular contributions can increase the portfolio faster than dividends alone.
Monthly Investment
A monthly contribution can be added to a long-term projection. For example, an investor might contribute a fixed amount every month. This creates another source of share growth.
Dividend Yield
Dividend yield compares dividend income with the investment price. However, investors should understand the exact yield method being used. Schwab notes that ETF yield figures can be calculated in different ways.
Dividend Growth Rate
Dividend growth estimates how the dividend per share may increase. A historical dividend CAGR can provide context. However, historical growth does not guarantee future growth.
Share Price Growth
A projection can also include an assumed share-price growth rate. This affects the estimated portfolio value. However, future market prices are uncertain.
Investment Period
The investment period shows how long the projection runs. Common examples include 10, 20, or 30 years. Longer periods can create larger differences between reinvestment and cash-income scenarios.
Reinvestment Setting
The DRIP setting determines whether dividends are reinvested. Turning reinvestment on can create a different future share count. Turning it off can show the income received as cash.
SCHD Dividend Snowball Example
A Simple Starting Example
Consider an investor who starts with a hypothetical $10,000 investment. The investor also adds $100 each month. The example assumes dividends are reinvested. It also uses assumed growth rates for illustration.
The First Stage of the Example
At the beginning, the portfolio has its initial share count. The monthly contribution then adds new investment. Quarterly dividends can add another source of growth. Therefore, the portfolio can grow from both contributions and reinvestment.
The Middle Stage of the Example
After several years, the share count may become larger. The larger share count can generate larger dividend payments. Those payments can then purchase more shares. As a result, the snowball can become more visible.
The Long-Term Stage of the Example
After decades, the difference can become much larger under certain assumptions. However, the final result depends heavily on the inputs. The example should never be treated as a guaranteed future return.
Why Calculator Assumptions Matter
A small change in an assumed growth rate can produce a large difference over many years. Therefore, investors should test multiple scenarios. Conservative, moderate, and optimistic assumptions can provide a broader view.
Dividend CAGR and SCHD Dividend Growth
What Dividend CAGR Means
CAGR means Compound Annual Growth Rate. It describes the average annual growth rate over a specific period. It can help investors understand historical dividend growth.
Why Dividend CAGR Is Useful
Dividend CAGR can provide context when studying historical dividend growth. However, it does not predict future distributions. Companies and funds can experience different growth rates over time.
Dividend Growth Is Different From Price Growth
Dividend growth measures changes in dividend payments. Price growth measures changes in the market price. Total return considers both price movement and distributions. Therefore, these measurements should not be treated as identical.
Historical Performance Has Limits
Schwab reports historical SCHD performance across several periods. For example, its current data shows annualized market-price returns for one, three, five, and ten years. Schwab also states that past performance does not guarantee future results.
Yield on Cost and SCHD Dividend Income
What Is Yield on Cost?
Yield on cost compares current annual dividend income with the original investment cost. It can help investors understand income growth over time. The metric becomes more interesting when dividend payments grow.
A Simple Yield on Cost Formula
The basic formula is:
Yield on Cost = Current Annual Dividend Income ÷ Original Investment × 100
For example, an investor can compare future dividend income with the original amount invested. This can show how the income stream has changed.
Yield on Cost Does Not Measure Total Return
Yield on cost focuses on dividend income. It does not directly measure current portfolio value. It also does not measure price appreciation. Therefore, it should be used alongside total return and portfolio value.
SCHD Dividend History and Payment Data
Why Dividend History Matters
Historical dividend data can help investors understand past payment patterns. It can also help identify changes in distribution amounts. However, historical data should not be used as a promise of future payments.
Quarterly Payments Can Change
SCHD distributions can vary from one payment period to another. Schwab’s official records show different distribution amounts across recent quarters.
Ex-Date and Payment Date Are Different
The ex-dividend date and payment date have different purposes. The ex-date relates to eligibility for the distribution. The payment date is when the distribution is scheduled to be paid. Investors should check official fund information for current dates.
SCHD Total Return and Dividend Income
Dividend Income Is Only One Part of the Picture
An investor may focus on dividends because income is easy to understand. However, total return also considers changes in investment value. Therefore, dividend income should not be viewed as the complete investment result.
Price Appreciation Can Affect Portfolio Value
SCHD’s share price can rise or fall. When the price increases, the portfolio value may increase. When the price falls, the portfolio value may decrease. Therefore, dividend income can continue while portfolio value changes.
Reinvestment Can Connect Income and Growth
When dividends are reinvested, dividend income can purchase additional shares. Those shares then become part of the portfolio. This connects income reinvestment with future share ownership.
How Investors Can Use a SCHD Dividend Snowball Calculator
Start With Realistic Inputs
The calculator should begin with realistic assumptions. The investor can enter the initial investment and expected contributions. Then, the investor can choose reasonable dividend assumptions.
Compare DRIP On and DRIP Off
A useful comparison is DRIP versus cash dividends. The DRIP scenario shows reinvestment. The cash scenario shows what happens when dividends are taken as income. Comparing both can clarify the effect of reinvestment.
Test Different Investment Periods
The investor can also test different time periods. A 10-year scenario can be compared with a 20-year scenario. A 30-year scenario can show how long-term compounding changes the results.
Review Share Count
Share count is one of the most useful outputs. A rising share count can show how reinvestment works. It also helps explain why future dividend income can change.
Review Annual Dividend Income
Annual dividend income shows the estimated yearly cash generation. This number can help investors set future income goals. Still, it remains a projection rather than a guaranteed payment.
Review Portfolio Value
Portfolio value estimates how much the investment could be worth under the selected assumptions. This can help compare income growth with capital growth. Again, market returns are uncertain.
Common Mistakes When Using a SCHD Calculator
Treating Projections as Guarantees
A calculator uses assumptions to create estimates. It cannot know future market prices or distributions. Therefore, calculated results should never be treated as guaranteed outcomes.
Using One Fixed Dividend Forever
Dividend payments can change. A model that keeps the same dividend forever may not reflect real-world conditions. A growth-based model can provide a more flexible scenario.
Ignoring Share Price Changes
Share price affects the number of shares purchased through reinvestment. Therefore, price assumptions can influence the snowball projection.
Ignoring Additional Contributions
Regular contributions can have a large effect over long periods. Leaving them out may create a very different projection. Investors should include contributions when they plan to make them.
Focusing Only on Yield
A high yield does not automatically mean higher total return. Yield calculations can also vary by methodology. Therefore, investors should review dividend income, growth, price movement, and total return together.
SCHD Dividend Snowball Calculator vs. Other Dividend Tools
Dividend Calculator
A dividend calculator estimates potential dividend income. It may focus on shares, dividend per share, or yield. This makes it useful for basic income planning.
Dividend Growth Calculator
A dividend growth calculator focuses on how income may change over time. It can use an assumed dividend growth rate. This helps investors explore future income scenarios.
Yield Calculator
A yield calculator focuses on the relationship between price and dividend income. It can be useful for comparing different investments. However, yield alone does not show the complete return.
Investment Return Calculator
An investment return calculator focuses more broadly on portfolio growth. It may include contributions and growth assumptions. Therefore, it can provide a wider view than a dividend-only tool.
Frequently Asked Questions About SCHD Dividend Snowball Calculators
What Is a SCHD Dividend Snowball Calculator?
A SCHD Dividend Snowball Calculator estimates how dividends may grow through reinvestment. It can model share count, dividend income, contributions, and time. The results depend on the assumptions entered by the investor.
How Does SCHD DRIP Work?
SCHD DRIP means dividend payments are reinvested into additional shares. The additional shares can then participate in future distributions. This creates a compounding process over time.
How Much SCHD Is Needed for $500 a Month?
The amount depends on the dividend rate and the share price. A calculator can estimate the required investment under selected assumptions. However, the required amount can change as distributions and prices change.
How Much SCHD Is Needed for $1,000 a Year?
The answer depends on the annual dividend per share. An investor can divide the desired annual income by the expected annual dividend per share. The result is an estimate and should be updated with current data.
Can a SCHD Calculator Predict Future Returns?
No calculator can accurately predict future investment returns. A calculator can only model possible outcomes from selected assumptions. Market prices, distributions, and dividend growth can all change.
Conclusion: Build the Dividend Snowball With Better Planning
Reinvestment Can Change the Long-Term Picture
Dividend reinvestment gives each payment another job. Instead of leaving the dividend as cash, it can purchase more shares. Those shares can then contribute to future dividend income.
The Share Count Is a Key Part of the Snowball
A growing share count can help explain dividend compounding. Each reinvested payment can add to ownership. Over time, the effect can become more noticeable.
A Calculator Makes the Process Easier to Understand
A SCHD Dividend Snowball Calculator can turn complex assumptions into simple projections. Investors can test starting investments, monthly contributions, dividend growth, and DRIP settings. They can then compare different scenarios.
Use Current Data Before Making Decisions
Investors should verify current SCHD distributions, holdings, and performance data before using a projection. Schwab provides official fund information and current distribution records.
Try the SCHD Dividend Calculator
For a practical starting point, investors can use the SCHD Dividend Calculator to explore dividend income under different assumptions. The calculator can help turn a long-term dividend strategy into a clearer projection.
Final Reminder
Dividend investing involves risk. SCHD’s future dividends and market value can change. Therefore, calculator results should be treated as educational estimates. They should not be viewed as guaranteed investment results.

Welcome to SCHD Calculators! I’m Saim Raza, a Paid Advertising & SEO Professional with 2.5 years of hands-on experience.
I specialize in Meta Ads (Facebook & Instagram), TikTok Ads, Google Ads, and YouTube Ads. I also work with SEO to help websites improve visibility, attract traffic, and grow online.
My goal is to make digital marketing simple, practical, and effective for businesses worldwide.
Pingback: SCHD Dividend Calculator: Calculate Your Dividend Income